TL;DR — four new fundamentals endpoints, one daily-refreshed ratios feed, and a developer experience designed for screens, research, and automated reporting.
Why this matters
For years, the most painful part of fundamentals has been stitching filings, prices, and share counts into something you can actually screen or model on. Our new Financials endpoints deliver normalized Balance Sheets, Cash Flow Statements, and Income Statements across quarterly, annual, and TTM frequencies. Additionally, the new Ratios endpoint combines those statements with point-in-time price and shares to compute valuation, profitability, liquidity, leverage, and EV multiples for the latest trading day, all in one call.
If you’re migrating from the old “experimental financials” API: it’s deprecated in favor of these v1 endpoints. Start here going forward. You must be on our stocks advanced plan to
What’s new (at a glance)
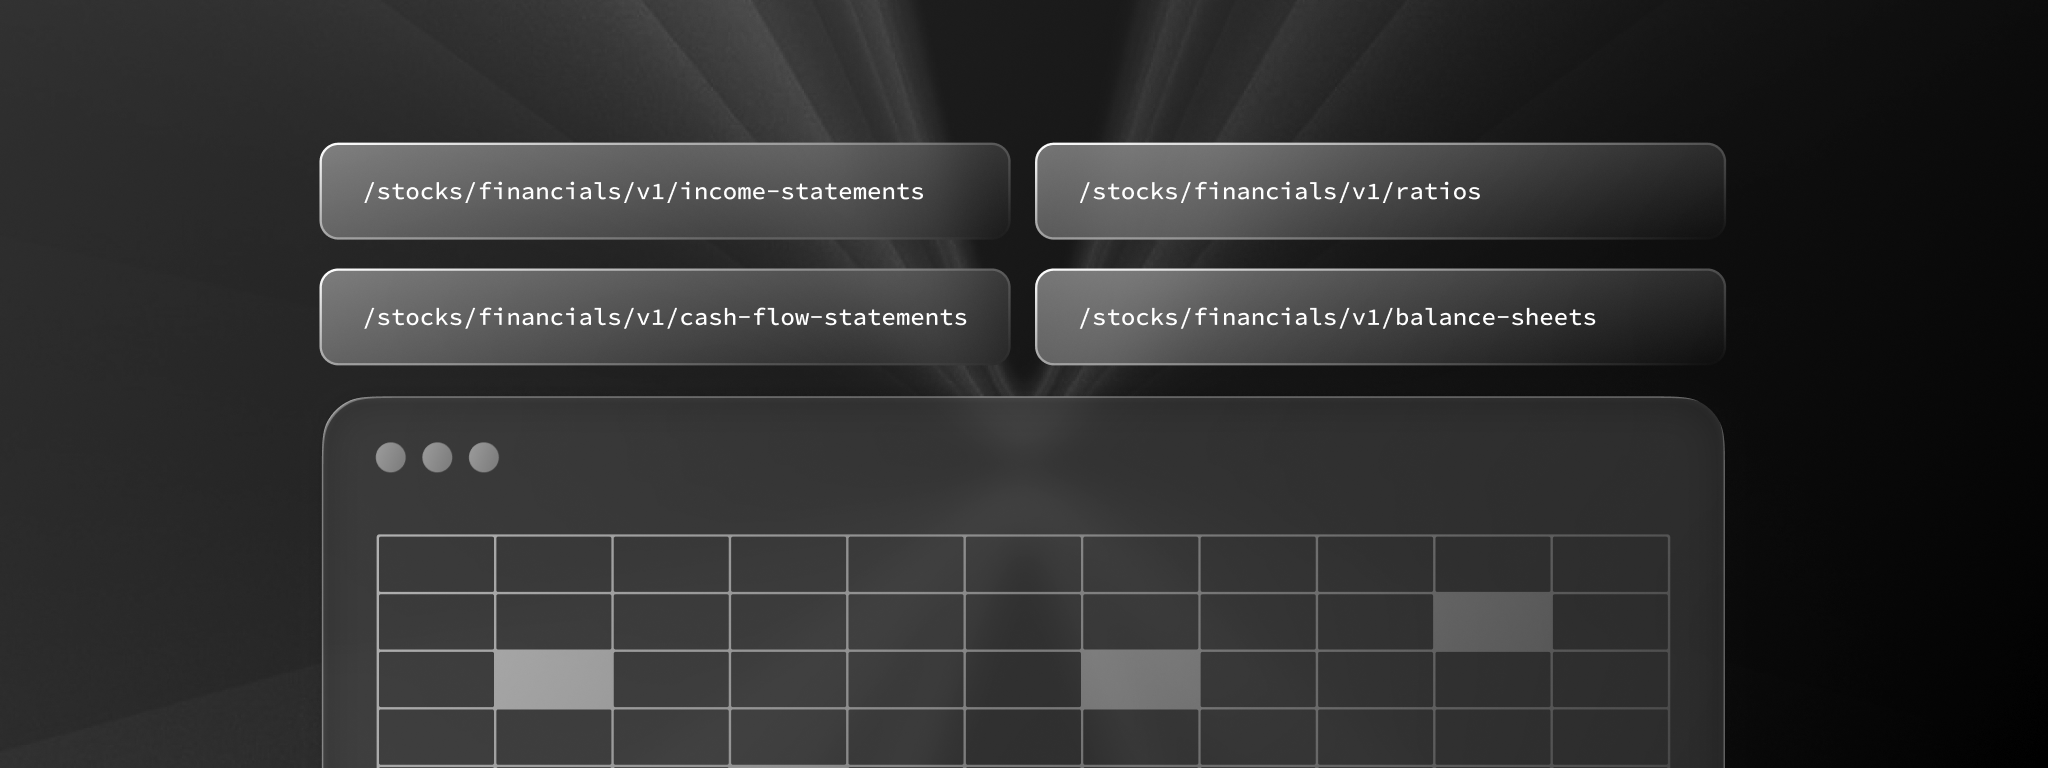
- Balance Sheets — /stocks/financials/v1/balance-sheets — Point-in-time assets, liabilities, equity; quarterly & annual; all history. Ideal for leverage & liquidity analysis.
- Cash Flow Statements — /stocks/financials/v1/cash-flow-statements — Operating, investing, financing cash flows; quarterly, annual, and TTM. Perfect for FCF and quality-of-earnings work.
- Income Statements — /stocks/financials/v1/income-statements — Revenue, margins, expenses, net income; quarterly, annual, and TTM. Great for growth & profitability trends.
- Ratios — /stocks/financials/v1/ratios — Daily snapshot of P/E, P/S, P/B, EV/EBITDA, ROE/ROA, current/quick/cash ratios, dividend yield, EPS, FCF, EV, market cap, and more. Always computed with the latest price and filings.
Coverage & cadence: Financial statements go back well over a decade with quarterly, annual, and TTM; ratios are updated daily for active tickers.
A quick tour for developers
1) Balance Sheets — capital structure & solvency
What it does: Returns point-in-time positions (what the company has and owes).
Why it’s useful: Evaluate risk, compute Debt/Equity, Current/Quick/Cash ratios, or track working-capital cycles over time.
Sample use cases:
- Risk dashboards for covenant monitoring
- Screens for net-cash or low-leverage companies
Python sample:
from polygon import RESTClient
import json

client = RESTClient(api_key="KEY")

# Get the raw JSON response
response = client.list_financials_balance_sheets(
    tickers="AAPL",
    fiscal_year=2024,
    fiscal_quarter="4",
    timeframe="quarterly",
    raw=True
)

# Decode and print the JSON
json_data = json.loads(response.data.decode('utf-8'))
print(json.dumps(json_data, indent=2))
Sample response:
{
  "status": "OK",
  "request_id": "REQUEST_ID",
  "results": [
    {
      "tickers": [
        "AAPL"
      ],
      "cik": "0000320193",
      "period_end": "2024-09-28",
      "filing_date": "2025-08-01",
      "fiscal_quarter": 4,
      "fiscal_year": 2024,
      "timeframe": "quarterly",
      "cash_and_equivalents": 29943000000,
      "short_term_investments": 35228000000,
      "receivables": 66243000000,
      "inventories": 7286000000,
      "other_current_assets": 14287000000,
      "total_current_assets": 152987000000,
      "property_plant_equipment_net": 45680000000,
      "other_assets": 166313000000,
      "total_assets": 364980000000,
      "accounts_payable": 68960000000,
      "deferred_revenue_current": 8249000000,
      "debt_current": 20879000000,
      "accrued_and_other_current_liabilities": 78304000000,
      "total_current_liabilities": 176392000000,
      "long_term_debt_and_capital_lease_obligations": 85750000000,
      "other_noncurrent_liabilities": 45888000000,
      "total_liabilities": 308030000000,
      "common_stock": 83276000000,
      "accumulated_other_comprehensive_income": -7172000000,
      "retained_earnings_deficit": -19154000000,
      "other_equity": 0,
      "total_equity_attributable_to_parent": 56950000000,
      "total_equity": 56950000000,
      "total_liabilities_and_equity": 364980000000
    }
  ]
}
2) Cash Flow Statements — quality of earnings & reinvestment
What it does: Returns the movement of operating, investing, and financing cash flows in and out of a company.
Why it’s useful: Build free cash flow (FCF) models and capex discipline screens; separate core cash generation from buybacks/issuance.
Sample use cases:
- A “positive-FCF + buyback” screen
- Alerts when operating cash flow turns negative
Python Sample:
from polygon import RESTClient
import json

client = RESTClient(api_key="KEY")

# Get the raw JSON response
response = client.list_financials_cash_flow_statements(
    tickers="AAPL",
    fiscal_year=2024,
    fiscal_quarter="4",
    timeframe="quarterly",
    raw=True
)

# Decode and print the JSON
json_data = json.loads(response.data.decode('utf-8'))
print(json.dumps(json_data, indent=2))
Sample Response:
{
  "status": "OK",
  "request_id": "REQUEST_ID",
  "results": [
    {
      "tickers": [
        "AAPL"
      ],
      "cik": "0000320193",
      "period_end": "2024-09-28",
      "filing_date": "2025-08-01",
      "fiscal_quarter": 4,
      "fiscal_year": 2024,
      "timeframe": "quarterly",
      "net_income": 14736000000.0,
      "depreciation_depletion_and_amortization": 2911000000.0,
      "other_operating_activities": 2556000000.0,
      "change_in_other_operating_assets_and_liabilities_net": 6608000000.0,
      "cash_from_operating_activities_continuing_operations": 26811000000.0,
      "net_cash_from_operating_activities": 26811000000.0,
      "purchase_of_property_plant_and_equipment": -2908000000.0,
      "other_investing_activities": 4353000000.0,
      "net_cash_from_investing_activities_continuing_operations": 1445000000.0,
      "net_cash_from_investing_activities": 1445000000.0,
      "short_term_debt_issuances_repayments": 6945000000.0,
      "long_term_debt_issuances_repayments": -2558000000.0,
      "dividends": -3804000000.0,
      "other_financing_activities": -25531000000.0,
      "net_cash_from_financing_activities_continuing_operations": -24948000000.0,
      "net_cash_from_financing_activities": -24948000000.0,
      "change_in_cash_and_equivalents": 3308000000.0
    }
  ]
}
3) Income Statements — growth & profitability
What it does: Also known as the profit and loss (P&L), it returns revenue, expenses, and net income across quarterly, annual, and TTM periods of time.
Why it’s useful: One of the most important documents for assessing a company’s financial performance. Track growth vs. margin expansion, backtest rule-based earnings screens.
Sample use cases:
- “Rule of 40” style growth/profit filters
- Gross-to-operating margin compression detection
Python sample:
from polygon import RESTClient
import json

client = RESTClient(api_key="KEY")

# Get the raw JSON response
response = client.list_financials_income_statements(
    tickers="AAPL",
    fiscal_year=2024,
    fiscal_quarter="4",
    timeframe="quarterly",
    raw=True
)

# Decode and print the JSON
json_data = json.loads(response.data.decode('utf-8'))
print(json.dumps(json_data, indent=2))
Sample response:
{
  "status": "OK",
  "request_id": "REQUEST_ID",
  "results": [
    {
      "tickers": [
        "AAPL"
      ],
      "cik": "0000320193",
      "period_end": "2024-09-28",
      "filing_date": "2025-08-01",
      "fiscal_quarter": 4,
      "fiscal_year": 2024,
      "timeframe": "quarterly",
      "revenue": 94930000000.0,
      "cost_of_revenue": 51051000000.0,
      "gross_profit": 43879000000.0,
      "selling_general_administrative": 6523000000.0,
      "research_development": 7765000000.0,
      "other_operating_expenses": 0.0,
      "total_operating_expenses": 14288000000.0,
      "operating_income": 29591000000.0,
      "other_income_expense": 19000000.0,
      "total_other_income_expense": 19000000.0,
      "income_before_income_taxes": 29610000000.0,
      "income_taxes": 14874000000.0,
      "consolidated_net_income_loss": 14736000000.0,
      "net_income_loss_attributable_common_shareholders": 14736000000.0,
      "basic_earnings_per_share": 0.98,
      "diluted_earnings_per_share": 0.97,
      "basic_shares_outstanding": 15343783000.0,
      "diluted_shares_outstanding": 15408095000.0,
      "ebitda": 32502000000.0
    }
  ]
}
4) Ratios — valuation & health in one call
What it does: Returns daily-refreshed ratios computed from TTM income & cash flow, latest quarter balance sheet, and the latest daily price & shares.
Why it’s useful: Easily get critical metrics, including P/E, P/S, P/B, EV/EBITDA, ROE/ROA, liquidity, D/E, EPS, EV, FCF, Market Cap, and more.
Sample use cases:
- Screener: “EV/EBITDA < 12, ROE > 15%, Current Ratio > 1.5”
- Portfolio tiles with dividend yield and debt safety
Python sample:
from polygon import RESTClient
import json

client = RESTClient(api_key="KEY")

# Get the raw JSON response
response = client.list_financials_ratios(
    ticker="AAPL",
    raw=True
)

# Decode and print the JSON
json_data = json.loads(response.data.decode('utf-8'))
print(json.dumps(json_data, indent=2))
Sample response:
{
  "status": "OK",
  "request_id": "REQUEST_ID",
  "results": [
    {
      "ticker": "AAPL",
      "cik": "0000320193",
      "date": "2025-10-20",
      "price": 262.24,
      "average_volume": 54815761.0,
      "market_cap": 3891743873600.0,
      "earnings_per_share": 6.69,
      "price_to_earnings": 39.2,
      "price_to_book": 59.12,
      "price_to_sales": 9.52,
      "price_to_cash_flow": 35.85,
      "price_to_free_cash_flow": 40.46,
      "dividend_yield": 0.0039,
      "return_on_assets": 0.2995,
      "return_on_equity": 1.5081,
      "debt_to_equity": 1.54,
      "current": 0.87,
      "quick": 0.83,
      "cash": 0.26,
      "ev_to_sales": 9.68,
      "ev_to_ebitda": 27.93,
      "enterprise_value": 3957172873600.0,
      "free_cash_flow": 96184000000.0
    }
  ]
}
Endpoint details & developer notes
- Pagination & sorting are supported across endpoints; bulk pulls are easy with limit + next_url.
- Ratios fields include price, average_volume, market_cap, earnings_per_share, price_to_*, return_on_assets/equity, current/quick/cash, debt_to_equity, enterprise_value, ev_to_*, free_cash_flow, with per-field docs and filters.
- Timeframes:
- Balance Sheet: quarterly, annual
- Cash Flow: quarterly, annual, trailing_twelve_months
- Income Statement: quarterly, annual, trailing_twelve_months
- License requirements:
- Your account must be stocks advanced or stocks business to access these endpoints. You can also purchase this functionality as an add-on.
Notes on methodology & expectations
Ratios are daily snapshots built from time-appropriate inputs (TTM, most-recent quarter, latest daily price/shares). Some ratios intentionally omit values (e.g., P/E when EPS ≤ 0) or return null when the denominator is zero. That’s by design to prevent misleading outputs. If a field is missing, check the omission criteria first.
